Monitoring (CloudStack)
StackConsole / CMP shows VM performance charts using monitoring data from Apache CloudStack only. You do not need to deploy a separate monitoring platform such as Zabbix, Prometheus, Grafana, or similar for this CMP monitoring view.
CMP does not require or recommend an additional monitoring stack for the built-in VM Usage Graphics experience. Metrics come from CloudStack’s instance metrics API / UI data path.
If your organisation already runs Zabbix, Prometheus, or another tool for ops alerting, that is outside CMP and is optional for your own operations — it is not part of StackConsole monitoring.
How it is implemented
| Question | Answer |
|---|---|
| Is monitoring included in StackConsole? | Yes — customers see charts in the CMP portal |
| Data source | CloudStack only |
| Separate Zabbix / Prometheus / etc.? | Not required for CMP monitoring |
| Supported recommendation for CMP | Use CloudStack metrics as exposed in CMP; no third-party monitoring product is required or supported as a CMP dependency |
Flow:
- CloudStack collects instance metrics (CPU, memory, disk, network) on the hypervisor / management path
- CMP reads that data through the CloudStack integration
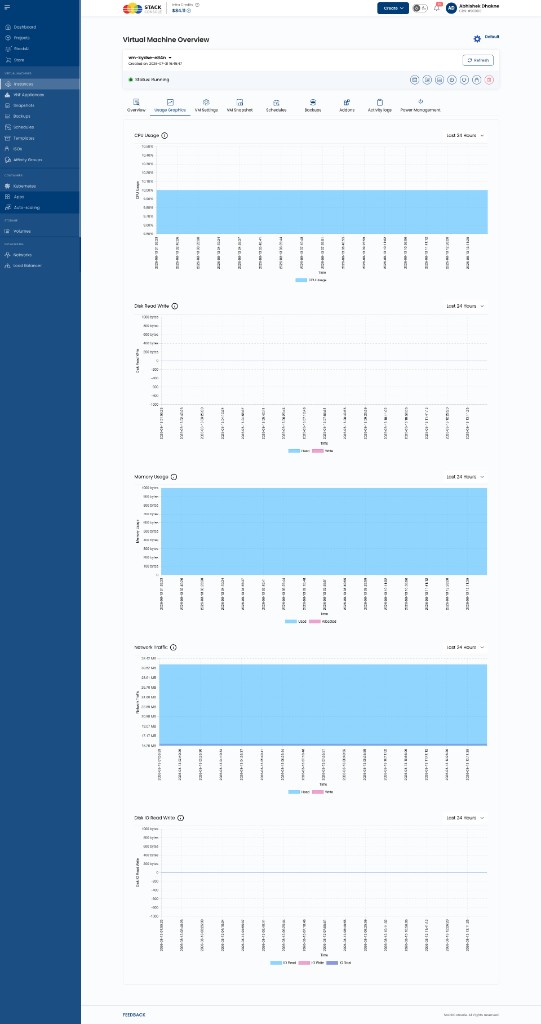
- CMP displays charts on the VM Usage Graphics tab
Where customers see it in CMP
Customer path: Virtual Machines → Instances → [VM] → Usage Graphics
Charts typically include:
- CPU Usage
- Memory Usage
- Disk Read / Write
- Disk I/O Read / Write
- Network Traffic (inbound / outbound)
Time ranges (for example Last 24 Hours) are available on the charts.
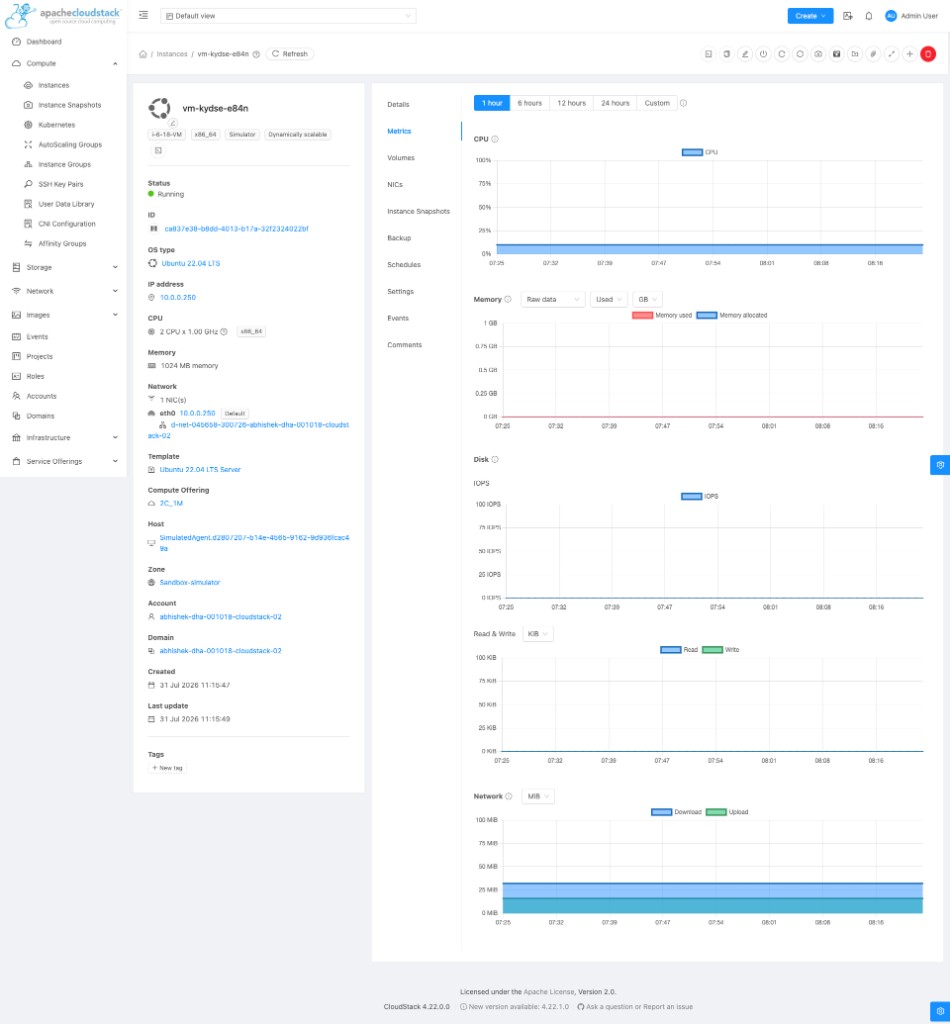
CloudStack Metrics (source)
In CloudStack, the same class of data appears on the instance Metrics tab (CPU, memory, disk IOPS / read-write, network). CMP uses this CloudStack monitoring data — it does not replace CloudStack with an external metrics store for this feature.
What this is not
| Topic | Notes |
|---|---|
| Alerting / paging | Built-in CMP Usage Graphics is for visibility, not a full NOC alerting product |
| Custom exporters | Not required for CMP monitoring |
| Billing usage | Usage Graphics is performance monitoring; invoice / usage billing is separate (see Billing) |